
Description
Delivers full-spectrum Far Red light with up to 3.23 µmol/J efficiency and three power modes for efficient vertical or hydroponic grows.
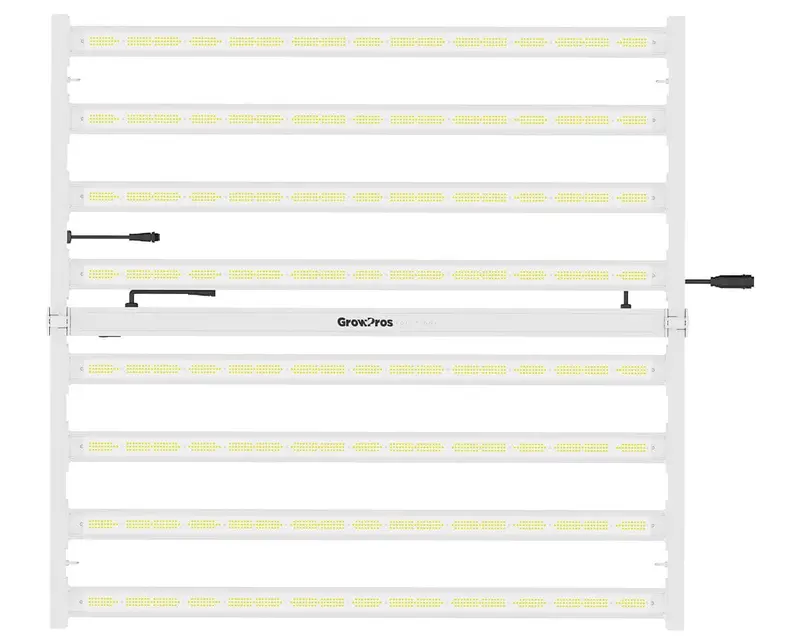
The GrowPros ULTRAPRO 960 LED Grow Light is engineered for high-performance hydroponic and vertical grow environments. Featuring a slim, foldable design and full-spectrum light with Far Red, it supports vigorous plant development from seedling to harvest. With three adjustable wattage modes: 960W, 830W, and 660W, you get precise control over output, efficiency, and energy use, making it one of the most versatile grow light LEDs in its class. Certified by ETL, DLC, CE, and FCC, and backed by a 5-year limited warranty, the UltraPro delivers professional-grade results growers can depend on.
Power Settings & Dimming
This grow LED light includes Governor Presets (960W, 830W, 660W) for facilities with limited power capacity. These presets let you easily adjust to available power in your grow room and act as a safety mechanism if needed. The presets also make them help in maximizing utility rebates. The UltrPro supports smooth dimming from about 1% to 100%, that is 0W to 960W but when a governor preset in engaged then the max power is limited to that setting.
Is the GrowPros ULTRAPRO 960 energy-efficient?
Absolutely. The UltraPro reaches up to 3.23 µmol/J, nearly twice as efficient as a standard 1000W HPS system (~1.7 µmol/J). The result is more usable light per watt and lower energy costs without sacrificing canopy intensity. Its passive cooling system minimizes heat output and maintenance, while Far Red supplementation boosts photosynthesis and flowering speed, making it one of the most productive and efficient grow lights on the market today.
Dimmable Spectrum
.process-containerultrapro { width: 100%; height: 16px; background-color: #333333; /* dark background track */ position: relative; cursor: pointer; border-radius: 2px;}.process-bar { height: 100%; background-color: #999999; /* lighter fill */ width: 0; position: absolute; top: 0; left: 0; border-radius: 2px;}.process-thumb { width: 20px; height: 20px; background-color: #046e82; /* teal knob */ border: 1px solid #000; border-radius: 2px; position: absolute; top: 50%; left: 0; transform: translate(-50%, -50%); cursor: pointer;}/* Labels on the bar edges */.bar-label { position: absolute; top: 50%; transform: translateY(-50%); color: #000000; font-size: 13px; font-weight: 600; pointer-events: none;}.bar-label.left { left: 0; /* Start of the bar */ transform: translateY(-50%) translateX(-100%); /* shift slightly outside */}.bar-label.right { right: 0; /* End of the bar */ transform: translateY(-50%) translateX(100%); /* shift slightly outside */} var chartultrapro = jQuery.noConflict(true); chartultrapro(document).ready(function(chartultrapro) { // Chart.js Setup const ctx = chartultrapro(‘#myChart_ultrapro’)[0].getContext(‘2d’); let chart; const dataset1ultrapro = { label: ‘Channel 1’, labels: [”,”, ‘360’, ”, ”, ”, ”, ‘395’, ”, ”, ”, ”, ”, ‘450’, ”, ”, ”, ”, ”, ‘500’, ”, ”, ”, ”, ”, ”, ”, ”, ”, ‘600’, ”, ”, ”, ”, ‘660’, ”, ”, ”, ”, ”, ”, ‘730’, ”, ”, ”, ”, ”, ‘780’, ”, ”, ”, ”, ”, ”], data: [0, 0, 0, 0, 0, 0, 0.2, 0.4, 1, 3, 10, 30, 40, 75, 30, 12, 6, 6, 10, 16, 21.5, 24, 25.4, 26.4, 27, 27.6, 27, 26, 24.6, 23, 21, 20, 24, 45, 99, 48, 18, 8, 4, 3, 4, 5, 6, 6, 4, 2, 1, 0.2, 0, 0, 0, 0, 0, 0, 0 ] }; const colors = [‘#ae00ef’, ‘#ae00ef’, ‘#ae00ef’, ‘#ae00ef’, ‘#ae00ef’, ‘#ae00ef’, ‘#ae00ef’, ‘#ae00ef’, ‘#ae00ef’, ‘#ae00ef’, ‘#65009f’, ‘#40009f’, ‘#1e149e’, ‘#103e93’, ‘#265aa8’, ‘#3173b8’, ‘#3698d5’, ‘#45bee3’, ‘#6fc4be’, ‘#6ebf80’, ‘#69b72d’, ‘#69b72d’, ‘#6bb72d’, ‘#79bc28’, ‘#97c626’, ‘#a8cc2b’, ‘#c8d933’, ‘#d8e036’, ‘#f1eb36’, ‘#f4c41c’, ‘#f19518’, ‘#ed761b’, ‘#e95619’, ‘#e62718’, ‘#e11713’, ‘#ce141b’, ‘#b91c22’, ‘#a91f24’, ‘#951e23’, ‘#851123’, ‘#7f191e’, ‘#7d191d’, ‘#76161b’, ‘#6a1216’, ‘#631014’, ‘#5f0e12’, ‘#51050a’, ‘#440104’, ‘#380103’, ‘#230304’, ‘#221714’, ‘#221714’, ‘#221714’, ‘#221714’, ‘#221714’, ‘#221714’, ‘#221714’, ‘#221714’, ‘#221714’, ‘#221714’]; let scale1 = 0; function createGradient(ctx, chartArea, colors) { const gradient = ctx.createLinearGradient(chartArea.left, 0, chartArea.right, 1); colors.forEach((color, index) => { gradient.addColorStop(index / (colors.length – 1), color); }); return gradient; } function createChart(labels, combinedData) { if (chart) { chart.destroy(); } chart = new Chart(ctx, { type: ‘line’, data: { labels: labels, datasets: [ { type: ‘line’, label: ‘PPF’, data: combinedData, borderWidth: 0.1, backgroundColor: function(context) { const chart = context.chart; const {ctx, chartArea} = chart; if (!chartArea) { return null; } return createGradient(ctx, chartArea, colors); }, borderColor: function(context) { const chart = context.chart; const {ctx, chartArea} = chart; if (!chartArea) { return null; } return createGradient(ctx, chartArea, colors); }, fill: true, tension: 0.4 // Smoothing effect }, { type: ‘line’, label: ‘Outline’, data: combinedData, borderWidth: 2, backgroundColor: ‘transparent’, borderColor: ‘#ffffff’, // Outline color fill: false, tension: 0.4 } ] }, options: { responsive: true, maintainAspectRatio: true, scales: { x: { stacked: true, grid: { display: false // Hide y-axis grid lines }, ticks: { color: ‘#000000’, autoSkip: false, // Prevent auto-skipping of labels maxRotation: 0, // Prevent label rotation minRotation: 0, // Prevent label rotation maxTicksLimit: labels.length // Ensure all labels are shown }, border: { width:2, color: ‘#000000’, // Change x-axis line color } }, y: { beginAtZero: true, max: 100, // Set a static max value for y-axis to accommodate added values grid: { color: ‘#444444’, }, border: { width:2, color: ‘#000000’, // Change x-axis line color }, ticks: { color: ‘#000000’, callback: function(value) { return value % 20 === 0 ? value + ‘%’ : ”; // Custom label formatting } } } }, events: null, radius: 0, plugins: { filler: {propagate: true}, // Enable filler legend: { display: false }, }, animation: { duration: 0 // Animation duration for smoother updates } } }); } function updateChart() { const scaledData1 = dataset1ultrapro.data.map(value => value * scale1); const combinedData = scaledData1; if (chart) { chart.data.datasets[0].data = combinedData; chart.data.datasets[1].data = combinedData; // Update outline dataset chart.options.animation.duration = 300; chart.update(); } } function createProcessBar(containerId, valueId) { const $container = chartultrapro(`#${containerId}`); const $thumb = $container.find(‘.process-thumb’); const $bar = $container.find(‘.process-bar’); const $currentValue = chartultrapro(`#${valueId}`); let dragging = false; let containerOffset = $container.offset().left; let containerWidth = $container.width(); let currentW = 100; // Update container metrics on resize function updateContainerMetrics() { containerOffset = $container.offset().left; containerWidth = $container.width(); setBarByWattage(currentW); } chartultrapro(window).on(‘resize’, updateContainerMetrics); // Initialize container metrics updateContainerMetrics(); // Function to set the bar and thumb position based on wattage function setBarByWattage(wattage) { currentW = Math.min(Math.max(wattage, 0), 100); const newLeft = (currentW / 100) * containerWidth; // Update bar width $bar.css(‘width’, `${(currentW / 100) * 100}%`); // Update thumb position using transform for better performance $thumb.css(‘transform’, `translate(-50%, -50%) translateX(${newLeft}px)`); // Update displayed value $currentValue.text(`${currentW.toFixed(0)}%`); // Update the corresponding scale variable and chart if (containerId === ‘process-container1ultrapro’) { scale1 = currentW / 100; } updateChart(); } // Function to handle the dragging logic function handleDrag(pageX) { const newLeft = pageX – containerOffset; const clampedLeft = Math.min(Math.max(newLeft, 0), containerWidth); const newWattage = (clampedLeft / containerWidth) * 100; setBarByWattage(newWattage); } // Throttle dragging using requestAnimationFrame let rafId = null; function onDrag(pageX) { if (rafId) return; // If a frame is already requested, do nothing rafId = requestAnimationFrame(() => { handleDrag(pageX); rafId = null; }); } // Mouse events $thumb.on(‘mousedown’, function(e) { e.preventDefault(); dragging = true; }); chartultrapro(document).on(‘mousemove’, function(e) { if (dragging) { onDrag(e.pageX); } }); chartultrapro(document).on(‘mouseup’, function() { dragging = false; }); // Touch events $thumb.on(‘touchstart’, function(e) { e.preventDefault(); dragging = true; }); chartultrapro(document).on(‘touchmove’, function(e) { if (dragging) { const touch = e.originalEvent.touches[0]; onDrag(touch.pageX); } }); chartultrapro(document).on(‘touchend touchcancel’, function() { dragging = false; }); // Click on the process container to set the thumb position $container.on(‘click’, function(e) { const pageX = e.pageX; onDrag(pageX); }); setBarByWattage(currentW); } // Initialize the chart function initializeChart() { const initialCombinedData = dataset1ultrapro.data.map(value => value * scale1); createChart(dataset1ultrapro.labels, initialCombinedData); } // Initial load initializeChart(); // Create Process Bars for Channel 1 and Channel 2 createProcessBar(‘process-container1ultrapro’, ‘global-value1ultrapro’); createProcessBar(‘process-container2ultrapro’, ‘global-value2ultrapro’); // Debounced Resize Handler to Redraw Chart on Screen Size Change let resizeTimeout; chartultrapro(window).on(‘resize’, function(){ clearTimeout(resizeTimeout); resizeTimeout = setTimeout(function(){ if(chart){ chart.resize(); } // Update container metrics for process bars chartultrapro(‘.process-containerultrapro’).each(function(){ const containerId = chartultrapro(this).attr(‘id’); const valueId = chartultrapro(this).siblings(‘.slider-paratitle’).find(‘.current-value’).attr(‘id’); // The process bars are already handling their own resize events // No additional action is needed here }); }, 200); // Adjust the timeout as needed }); });
Slide the Bar to See How the Spectrum Changes
.slider-paratitle { display: flex; justify-content: space-between; align-items: center; margin-top: 6px; font-weight: 600; color: #000000; font-size: 13px;}0% 100%
Features
- Experience optimal plant growth with our full spectrum, including Far Red lighting
- Perfect for vertical cultivation, our ultra-slim design maximizes space efficiency
- Designed for commercial use, supporting 208-277V power outlets for robust performance
- Enjoy hassle-free setup with our foldable design-simply open and use, no assembly required
- Power Options: 960W / 830W / 660W adjustable
- PPF Output: 2938 µmol/s (960W) | 2606 µmol/s (830W) | 2132 µmol/s (660W)
- Efficiency (PPE): 3.06 µmol/J (960W) | 3.14 µmol/J (830W) | 3.23 µmol/J (660W)
- Mounting: Overhead or vertical
- Automation: TrolMaster Hydro-X compatible (LMA-14 adapter)
- Rebate Eligible: Qualifies for many utility rebate programs
What’s Included?
- GrowPros ULTRAPRO 960 LED Grow Light
Download Resources
- Spec Sheet
Explore more from our collection.


Reviews
There are no reviews yet.